-

Recent Topics
Sponsored Links Your Ad Here
HOT Topics
Quick Links
-
 Lake Ontario Tweets
Instant Fishing Reports
-
 Join Mailing List
Direct to your inbox
-
 Fishing Log
Keep catch records
-
 Lake Ontario Store
LOU Merchandise
-
 LO Outdoors
Fishing Magazine
New York State Fishing

Upcoming Events
-
06 July 2024 04:00 AM Until 07 July 2024 09:00 PM

-


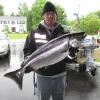
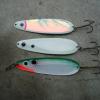

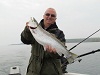
Recommended Posts
Create an account or sign in to comment
You need to be a member in order to leave a comment
Create an account
Sign up for a new account in our community. It's easy!
Register a new accountSign in
Already have an account? Sign in here.
Sign In Now