schreckstoff
-
Posts
239 -
Joined
-
Last visited
Content Type
Profiles
Forums
Events
Gallery
Store
Posts posted by schreckstoff
-
-
Nice and great report, thanks. Are you saying the treble was the mistake? Do u prefer running single hooks?
I like That spoon! Does it have a name?
-
Wondering what folks are seeing in the stomachs or on their graphs. Anything unusual, or different for this time of year?
-
How was the mtg? Was it well attended?
-
Apparition, I think the differences in the maps may be because GillTs map is based on satellite observations and the map you were showing is the results of the FVCOM model, for surface temperature. The Finite Volume Coastal Ocean Model uses bathymetry, wind, and air temperature observations data and a bunch of
equations to make predictions, whereas I think satellites are using direct infrared observations, which have trouble with clouds and are only surface temps. I’m out. Of my depths on this stuff but the NOAA sites and google have much better explanations. The FVCOM approach is state of the art and it’s super cool that GLERL has it up and running. For my research we use it a lot in the spring to figure out when and where we might dodge the ice to start sampling as early as possible in Chaumont Bay.
-
Oswego net pen and marker buoys are removed. We appreciate everyone's patience. We learned a lot about the process. We won't know the results until trawl surveys next year where we will see if we catch these Bloater in different proportion to those that were direct stocked.
-
My videography colleagues (https://m.facebook.com/AllTooClearFilm/) turned me on to Davinci Resolve, its free version seems quite powerful. There are lots of online tutorials,
-
 1
1
-
-
I take no offense nor blame and I think the discussion & debate is healthy. These threads are my favorite part of LOU.
GillT is right, that Bloater and LT rearing is Federal, but as requested by the Lake Ontario Committee.
The net is still out there, we are hoping to pull it on Friday. Thank you for your cooperation steering clear of the buoys! -
Dances, yes.
Like the pen stocked trout and salmon we are testing if we can improve survival when they have a few days to become ‘conditioned’ to the water where they are stocked. This is our first time trying anything like this so quite a few obstacles to overcome.
I’m aware of Cisco eating alewife in Lk Michigan and probably annywhere there are big Cisco and small alewife , but I haven’t heard or seen evidence of Bloater eating Alewife. Cisco tend to live shallower and closer to shore, whereas Bloater are smaller, live deeper, and focus on eating Mysis shrimp.
-
Great question, it’s never to my knowledge been observed but all the evidence suggests deep reef/rock/gravel spawning. The commercial fishers. Are probably the best source of that info. I’m Not sure we have habitat in LO anymore. I’m hoping we get some projects trying to figure that out, but information has a hard time going upstream in the Great Lakes.
-
The pen is north west of the lighthouse, is marked with 4 high flying float flags surrounding it, and 2 yellow surface floats.
The net will be in that location till Monday and then there may be another one set for a few days deeper. These are experiments testing ways to increase survival of stocked Bloater.
Best to give the marker buoys a wide berth to avoid snagging and losing gear. Happy to address questions or concerns. Thank you!
-Brian Weidel
-
Great Lakes Fishery Commission puts out schedules that might have what you are looking for. Past few years are below.
2021
http://sealampreycontrol.info/temp/2021 Treatment schedule.pdf
2022
http://www.glfc.org/temp/2022 Treatment schedule.pdf
2023
-
1
-
-
-
-
14 hours ago, whaler1 said:
I don’t want a wrong wind spring.
What Whaler said!! The forecast is dismal right now.
-
Water level appears “up” to me (observing from Oswego). IJC graph suggests about 8” above average.
-
1
-
-
Well put!
-
Record Alewife year class?
-
Thanks for the update!
-
A Lake Ontario specific study on this topic:
Bioaccumulation of perfluoroalkyl substances in a Lake Ontario food web
https://www.sciencedirect.com/science/article/abs/pii/S0380133021001799
-
1
-
 1
1
-
-
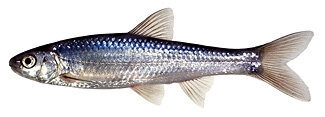
Oldest I see in our records is Age-7. Not many in that age (0.06%) and length on the age-7 ranged from 6 to 8 inches. Largest I see that we interpreted an age is almost 9 inches and that one was interpreted as age-4. You might have seen in my talks how Alewife growth (size at age) changes when fish hook and spiny water flea populations are really abundant. Interestingly those changes didn't seem to change RS growth.
-
Interesting, Thanks for sharing !
-
I think it might not be done for a year or so. They have some really cool Salmon footage from L Michigan. They are amazing videographers, I am hoping to try and film deep April Alewives, out in 400ft, this Spring. Oh that’s 120m for Yankee, ha!
-
https://mobile.twitter.com/alltooclearfilm
Link to the film I was talking about last night at the LOCBA meeting. (Sorry for my audio visual issues)
These film makers are great to work with, they get some truly amazing underwater footage!
-
1
-
-
IMO From a fish habitat perspective those 6 dams on the Oswego River have some of the , if not the largest negative impact on LO fish populations AND local resource based economies. The canal creates completely nonnative impounded aquatic habitat in place of what would be 25+ miles of high gradient warm-cool water river habitat that would produce or support walleye, SMBs, sturgeon, American Eel, and likely many of other native fishes, in addition to the lake-run fisheries for salmonids. The Dams Also limit what I surmise would be impressive rafting - kayaking opportunities. The Dams limit the natural recruitment and pulse of wood into the lake which I suspect doesn’t help the ever dwindling native lake population of Slimy Sculpin which use wood to spawn (adhesive eggs).
In the place of these resources there is some modest electricity produced , that from my understanding does not lower local energy costs , And of course the ever important a handful of boats get to traverse to Lake Ontario from the canal. Would live to see the math on what that contributes locally.
From a decision making standpoint it seems very odd to me why those dams are still in operation. If I owned land in that area I’d be asking my representatives daily why support habitat destruction and impede resource based economies. Maybe this will be windmill I tilt at in my retirement.
soap box over, happy to hear and consider alternative viewpoints
Sandy 7/6 morning and evening
in New York Fishing Reports - Lake Ontario (South Shore)
Posted
thanks for the tips and the spoon name!