

iiwhistlerii
-
Posts
407 -
Joined
-
Last visited
Content Type
Profiles
Forums
Events
Gallery
Store
Everything posted by iiwhistlerii
-
 Everybody said the same in 2018. Wet spring never came and we were fine. It all comes down to snow melt and precipitation.
 -
But none of that has to do with 2014. None of this has been altered by 2014s parameters because the water has been too high to allow them to take effect since its come into play. 2014 allows for lower winter water levels on lake Ontario. It actually has parameters that allow us to let more water out than they ever did previously. Currently we are letting out more than any of us have ever seen in the month of December. With all this happening we still are somehow placing blame on 2014. It's just not the case. All i keep reading is "they arent doing all they can do". Please find me a time in history when they have done more, let out more or kept flows high longer. You all act like I have a horse in the race or money to be made from 2014. I could care less in the end but the facts lead to the same conclusion no matter how u look at it. All the great lakes are at record or near record levels, so are we and that's no coincidence caused by a water management plan.
-
Sorry I misspoke. 10 inches over 2018 december. Correct we are 18 over long term avg. We will be 20 after next month I bet. Point is we went from the same level over avg as erie to 12" lower. We are dropping much faster than Erie currently thanks to increased flows.
-
Typical december flows would be in the 6000's. Maybe the low 7s. Today we are still flowing at over 8600. Yes we are down from the 10,400 raging flows of summer but 8600 is still incredibly high especially for December. This is the part people are failing to realize or refusing to acknowledge.
-
As it has been maintained. The lake has dropped incredibly. Erie is still 30 inches over avg and Ontario is only 10 inches higher than normal. Wouldnt that tell you we are more than "maintaining". Sent from my SM-G965U using Tapatalk
-
It doesnt work that way. By august 21st the lake was down 2 feet from where it high point. Please find me where this winter draw down that always happens didnt happen in 17, 18 or 19. Please please please use data to find me when they held in more water than any of the prior 10+ years under 2014. Oh yea, u wont, because they let out more, even during winter months. You guys act like it's all a man made act that controls this flow. When the lake is 40 inches high it's easy to reach numbers like 10,400. When it's only 10 inches over avg like it is now you arent going to get those numbers no matter what you do. The water isnt there to flow at that rate. That's why it decreases as summer goes on and into fall. As the lake drops flow drops. Its nature and physics at work. When they do raise flows to an unnatural level lake st. Lawrence drops above the dam because flow isnt fast enough from lake ontario to keep it full. That's why flows are adjusted as they are and even adjusted daily to account for wind, ice, etc. Feel free to look at the data from the last 20 years of outflows and it helps to understand to the hows and whys. It isnt a faucet attached to a dam face holding back lake ontario, it's is a series flood control reservoirs along a dredged river that has constantly fluctuating flow levels.
-
Did you read the article? I did back in November when it came out. They are complaining about the high flows coming through the lower st. Lawrence and blaming them for having to hold back the Ottawa at the dams as to not wipe out Montreal. So they are complaining about the high flows below the dams while we complain every single time that flow is slowed. When they talk about keeping the st. Lawrence high for shipping they are talking about BELOW THE DAM for port of Montreal. That involves letting out more water. Everyone wants to blame 2014 but one side blames for 1 reason and the other for a different reason and they only thing anyone can agree on is that lake ontario is too damn high and it's all the IJCs fault.
-
Amazing how fast people forget... It was just a few years ago marinas were so low many docks were unusable. We were all complaining about how they were giving all the water away to the middle east and the lakes were drying up. Boats bottoming out as they entered harbors, constant complaints that everything needed to be re-dredged. Now here we are 8 years later with every great lake as high as we've ever seen. Stop buying into the world is ending scenarios the media is constantly selling. This too shall pass, we will have a few acceptable years with "normal" conditions before the next dry spell where we can all discuss how the lakes are drying up and the ijc let out too much water because plan 2014 allows them to let out more than previous plans and now the permanent boat slip and docks I built with poor designs in 2019 are all useless. Just hope for a dry year.
-
Theres been a 20 year high and low cycle since they've kept records. No reason to believe that all of a sudden it's going to be high forever now. Sent from my SM-G965U using Tapatalk
-
When the lake levels drop in 2 years like they always do and all these homes have brand new Gov subsidized 200k breakwalls I'm sure itll be added to the property value when things are reassessed. Dont think for s minute any local municipality will miss that opportunity. Sent from my SM-G965U using Tapatalk
-
No . The Ottawa flooded from record precipitation and snow melt. The same exact reason every great lake is at record levels. The area where it meets the st Lawrence below the carillion dam known as lake of 2 mountains had water lines 9 foot above normal last time I fished there. Sent from my SM-G965U using Tapatalk
-
Exactly and plan 2014 allows for lake ontario to be drawn down further than the previous plan!! Sent from my SM-G965U using Tapatalk
-
What? The st Lawrence doesnt flow into the Ottawa.... The Ottawa flows into the st Lawrence at Montreal. If we let the seaway flow at 10,400 during the spring (2019 summer flows)while the Ottawa was at record levels raging 9 ft above normal in spots it would have wiped areas of Montreal off of the map. Yes flows in the st. Lawrence below the dam have been elevated and sometimes extreme in the last 3 years.
-
Exactly. Those are normal flows. The flows the last 3 years have been far far above normal 95% of the time. Hard to blame our water levels on holding back water when flows have been higher than ever the entire time.
-
Because water was held back during high water periods on the Ottawa. We sacrificed a couple inches here so Montreal wouldnt be wiped off the map. Look at the data and u can see exactly when this occurred. At one point flows dropped into the 5000s for the day. It had nothing to do with plan 2014 tho, it was temporary reductions in flow that were exactly when the Ottawa was at its worst. Everything was precisely calculated and strategically implemented to have the least overall impact on everyone. It's the lesser of 2 evils. It had everything to do with the record amounts of precipitation we've had to deal with in our entire watershed. NYS is taking a stab at trying to recoup some of the funds they are dishing out hand over fist. I'm sure if the other great lakes had somebody to try and sue theyd do the same. Fact of the matter is they are dealing with higher water than even we are and dont have a scapegoat with deep pockets. The numbers dont lie, do the research for yourself.
-
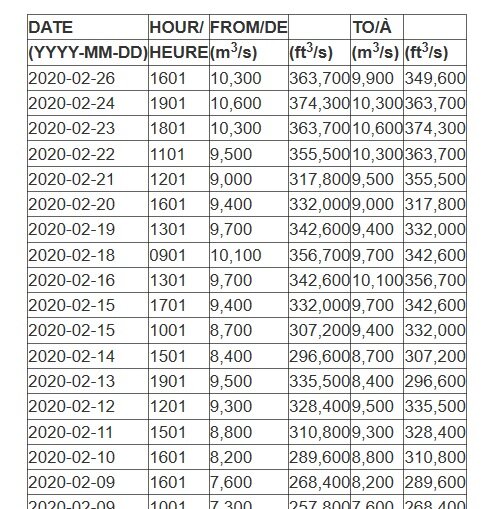
Lol. Yea holy hell did those get degraded with upload. Here is the link so u can see how much water passes through the seaway on a normal year. I believe data from 2011-18 can be found at the bottom. https://ijc.org/en/loslrb/watershed/outflow-changes More water has passed through the system in the last 36 months than any 36 months on record but somehow people are still blaming it on holding back water. It's a weird argument to have when faced with the facts.
-
This is the stuff I love. Flows consistently higher month after month than they were in 2014, 15, 17 and all the years before that actually but this is all because they are "closing the gates". Lmfao. Look at these numbers from pre 2017 years. Hell go back and look at flows from the last time we had high water 20 years ago. The outflows since 2017 have been higher than ever.
-
It's amazing people are complaining that those flows are "closing the gates". There are entire years that go by where flows barely break 8,000. Anybody who's compared those numbers with those of previous years has to realize this has nothing to do with them "holding back water". More water has been let through the seaway in the last 3 years than any 3 years in history. Sent from my SM-G965U using Tapatalk
-
The water level of lake Ontario has zero bearing on the rest of the great lakes. We can stop debating this now. Its fact.
-
A lock system. Again separated by waterfalls between walls and drops that equal 167' and in zero way effected by the height of lake Ontario.
-
Back pressure..... On Niagara falls.. A water fall. Ur saying the height of Lake Ontario effects how fast the water plummets 167' to the area below. You may want to rethink that. Simple hydraulics. Merry Christmas boys. Sent from my SM-G965U using Tapatalk
-
Yup, ottawa was back to normal in June as rivers tend to do after spring flooding. Just as the outflows were increased to safe maximums as it receded as ur chart shows. In fact that was the only time in your chart that flows were actually "reduced". Since we are going to start bringing numbers into the conversation, trust me I've read them all in this case, let's bring the correct numbers into the conversation. We actually spent most of the summer at 367,270k. Although your single day record number of 378k is correct (1993) it only actually happened for very brief periods on 3 separate days during that year. (Extreme west winds combined with high water) Previous recorded sustained flows were 364k which were in place most of the summer in 2017. This summer they actually increased flows another 200 cubic meters from 10,200 (364k) to 10,400 (367k). Now keep in mind this number is calculated by including all water that passes through the Moses Sauders power dam, water that passes over the spillway at the Long Sault dam, the massena diversion and the diversion at the raisin river. Those flows arent possible in the winter, they wont let water come over the spillways and bust up the ice below the long sault. Flows have been up over norms and even historical highs since the Ottawa receded in june. Current levels are safe maximums and are right in line if not higher with what has always been practiced. Last but not least since you knowledge even extends to the guy in the photos ice conditions. 4 inches of solid ice where hes at in the photo and ice is shore to shore right there.
-
Just a quick post for those that doubted my claims last week that ice was just days away below the dam on the St. Lawrence. This photo is from yesterday, if you look closely that's the moses Saunders dam in the background to the far right.
-
Todd apparently we havent met. My name is John Pensyl. I live in Niagara county and am an avid fisherman. If you think for 1 second I'm any different in person you may want to ask those who know me. I'm very opinionated because I'm very well read and take the ample time to research. Do I support 2014? I'm not sure if I do because it hasnt had a chance to really take effect yet. Do I blame 2014 for current water levels on lake Ontario? No, because my personal research and comparisons led me to the conclusion that we'd be right here under the previous management plan. Happy to civilly discuss this face to face at any point in time as I have at many docks and fishing trips for the past 2 years. -John Pensyl Sent from my SM-G965U using Tapatalk
-
I keep reading this "closed the gates". No changes in outflows were made when 2014 took effect in jan 2017. In fact he exact same outflows would have been used under the previous management plan. No "gates" were ever closed. Hell no changes were even made. Just the name on the door. 1 normal spring and the end of this cyclic event and all will be fine. Like I said before I just hope everyone was smart enough to build the new docks as floaters so ur not jumping down into the boat during the next dry spring and low water cycle.