

iiwhistlerii
-
Posts
404 -
Joined
-
Last visited
Content Type
Profiles
Forums
Events
Gallery
Store
Posts posted by iiwhistlerii
-
-
1 hour ago, HB2 said:
What you are saying is that 2014 and the IJC has no responsibility in all this whatsoever .
I feel that they are at least partially responsible for this mess .
It was under control for many years .
And the last 2 out of 3 were the worst ever .
Also 2 out of 3 highest ever on all the great lakes. Records set on Ottawa in 2017 were broken in 2019. Wettest april and may records set in 2017 broken in 2019. Coincidence or not its fact you cannot ignore. The lake is at record levels because it's taken on record amounts of water. That's fact, its backed up by the fact that its dumped record amounts of water.
-
I already explained many times that I fish all over the great lakes. I live in Niagara county and use launches in Monroe, Orleans and Niagara county on a regular basis. I'm on the water far more than most. I have family with property right on lake Ontario. Obviously I'd like to see the lake level reduced, I'm just not going to sit there and pretend its caused by something it's not just so I can assign blame. Since this all began I've fished Georgian Bay with nearly unusable ramps, Lake St. Clair with incredible lake levels pouring up into parking lots and flooding neighborhoods, the ottawa with water lines on second story roofs and 9 foot up above where I normally launch, and lake Erie with record levels that have had driftwood floating up into parking lots on the lake and Niagara for months. My interests are for everything to return to normal so I dont have to deal with power launching and loading my boat without docks anymore. I more than most want lake Ontario back to normal, I'm just not willing to turn a blind eye to the facts and the fact that it's not being caused by anyone holding back water.
Sent from my SM-G965U using Tapatalk -
Use this theory to explain record levels on almost every body of water on the great lakes water shed. Please use it to explain for all the slip holders, cottage owners and charter captains on almost every other great lake that also had never experienced these water levels in there extensive experience. Use it to explain water levels higher than were ever seen before on the upper Ottawa, an area whose drainage basin shares much of the exact weather we recieve in our own. Use it to explain the breaches levys on the Ottawa, the near dam failures all over the north east including here on lake ontario tribs, use it to explain to this cottage owner on Huron who is complaining it's the highest hes ever seen the water in 50 years. You cant, 2014 got to show its face for 3 months from jan 2017 to april 2017. Then we saw 2 of the wettest months of all time and it's been operation drain the lake ever since and the numbers prove it.
As previously stated. All I have is my extensive experiences on LO and particularly the Sandy Pond area. We knew that p2014 was going to be trouble. And we were right. Before this conspiracy was adopted , we knew that by the end of Aug or early Sept. it was time to pull the boats , as the slips were getting too shallow. Boat launches needs all of the ramp to launch. Our camp on S Sandy , where normally it was waist deep , was dry. It was the norm and planned for every year. Till now. This is year after year for 50 plus years. You can say all you want , the high water is not due to IJC , St Lawrence seaway authority and p2014. The evidence says differently
Sent from my iPhone using Lake Ontario United mobile app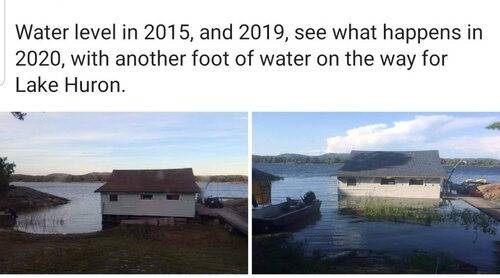
Sent from my SM-G965U using Tapatalk
-
In the past the area below the dam has dropped so low that many boat ramps arent even usable. Theres been a few falls in the past where I'm waiting at the ramp for am power production to begin so the water will rise at Hawkins point and I can launch my boat. 2014 was meant to stabilize all this, more natural highs and lows above the dam and more stable water below. It may work amazingly once it actually gets a chance to function as designed. What weve see. In the last 3 years has absolutely nothing to do with 2014 as its peramiters and set flows have yet to be touched.
Sent from my SM-G965U using Tapatalk -
Gambler how does that argument apply in this situation tho? Yes 2014 will indeed help power production and extend shipping. What is going on now has nothing to do with 2014 and isnt helping either. 2014 allows them to let lake ontario higher each summer, it has higher trigger points. Problem is weve been over those trigger points since it's been implemented so it hasn't come into play yet. It also allows the lake to get lower during the winter before the trigger points to cut flows come into play. Again, non factor so far. 2014 helps shipping and power production by allowing them to not have to cut flows ever. With 2 inches more water in the lake during summer and allowing it to drain 2 inches lower each winter the hope is that they wont have situations where they have to cut flows in the fall that cause the lower st. Lawrence to drop to a level where it's too low for the large ships using port of Montreal and where they are losing money due to less power production. None of this has come into play in the last 3 years.The thing being ignored is the board members and there vested interests. There are board members with vested interest in shipping and electricity production. I guarantee, more cod have been done but was not due to vested interests. It takes a unanimous vote to make changes with the board.
Sent from my iPhone using Lake Ontario United mobile app
Sent from my SM-G965U using Tapatalk
-
You can see where flows were reduced to establish safe ice this month and now are being pushed back up with the warm up. Theres no conspiracy to any of this it's all exactly how its always been done and all well above the 2014 peramiters because of the high water. Expect flows to be reduced when ice begins to form again and then brought back up when safe ice is established. It's the same process they've done every year for 60 years.
-
I just went back and read through to find Gamblers question. Sorry I had missed it before. Why did the ijc reduce flow in august? The answer is pretty obvious. Everyone keeps making the claim that the outflow number is 100% determined by the ijc. You keep leaving out the environmental factors that also calculate into that flow number. The number 1 factor being water level and how much water is actually coming down the river. When the lake was at record levels we had record flow. Just like when erie is at its highest the Niagara flows the hardest. When Ontario is 40 inches higher than normal the st Lawrence obviously flows harder and pushes more water than when its 20 inches over normal. So why did flow decrease? Because water levels decreased. Basically flows dropped from all time record highs to previous record highs. Not much of a reduction really. Now let's look at the actual reduction. We are still today pushing out more water than any other time in history. 2014 calls for flows in the 7000s right now with its peramiters and the previous plan was actually less than that as it reduced winter flow more than 2014 does. October 13th is the only real day flows were something anybody could consider low and my guess is there was heavy ne winds that day that reduced flow of the river. When those winds stopped, the flow increased.
-
2 minutes ago, lost a lure said:
IJC propaganda video
Sent from my SM-G950U using Lake Ontario United mobile app
Yea from 6 years ago when you still loved and trusted the IJC.
-
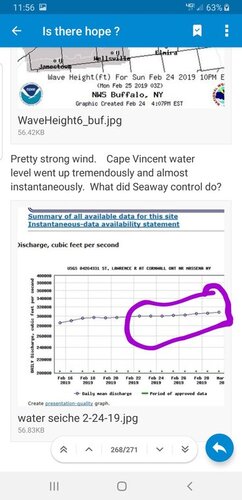
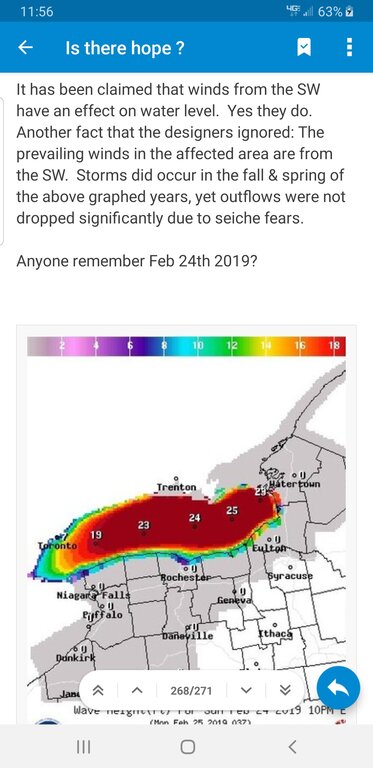
Let's take a look at this horrible argument... you are complaining flows were not decreased from an extreme sw wind. Why the hell would flows decrease when the river is flowing harder? SW wind pushes more water down the river and naturally increases flow. The ijc doesnt have to do a thing, they dont 100% control the flow level of the river. A stiff sw speeds it up just as a stiff NE slows it down. Let me explain this 1 more time.
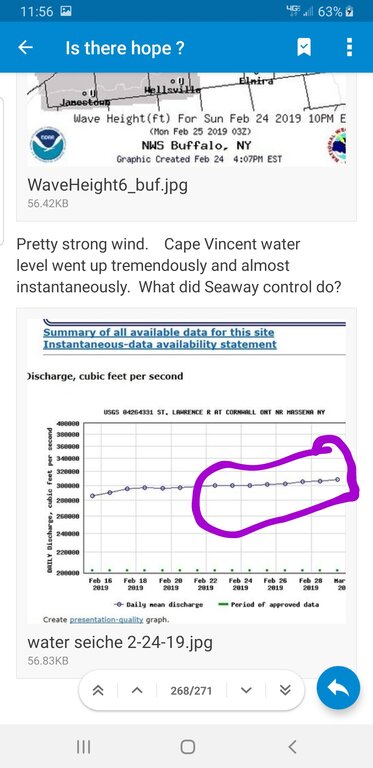
Big SW wind.... see the image u posted. Stiff winds and storm surge feb 24s. Ok now look inside the area I circled purple and watch what happens... Flow goes up!!! Its magic!!

-
Also how do u fail to acknowledge 20 year cycles on lake Ontario?? Take a look at ur own graphs! You are blind to what doesnt support your argument. Looking at the chart from 1918-2016 to can clearly see a 20 year cycle. Narrowing it down to just 1958 until present u can still see 5 year high water fluctuations just about every 20 years. Late 50s, mid to late 70s, mid to late 90s and present all share the highest water points on the graphs. The fact that u chose not to see or acknowledge that is just sad. Again I'll keep posting facts and you can respond by twisting data and ignoring things that dont support ur arugment.
-
Tom the fact that your complaining about the iroquois being closed all summer just solidifies that you have no intention to learn how the system works or why they make the choices they do. We arent following 2014 peramiters and havent yet. If we were flows would be much lower right now. They are higher than they've ever been for this time of year and have been that way for years. It doesnt matter what data or facts are shown. When a mind is made up facts dont matter. There are a series of videos explaining how the system works that can be found online. I'm tired of debunking shotty ideas and opinions with actual facts and being shown graphs that when actually looked at do nothing but support what I've been saying all along. This video will explain how the iroquois helps to control flooding on the st Lawrence. There is another that will explain how it's used for ice. You complain it was closed the whole summer but outflow was at maximum that entire time so what are u actually complaining about.
-
2017 and 2019 they were closed the entire summer from april on. No personal watercraft was able to pass through and everyone had to use the locks. I'd assume anytime winds are stiff from the sw theyd close them to prevent a seich effect. Obviously they are there for a reason but I can remember many many times when none were closed in the past. I can remember being there during October many times where none of them were closed. Even when all closed or all open lake st. Lawrence still experiences extreme lows due to the narrowing of the river there and the delayed effect it creates.
The gates at Iroquois have been lowered at various times over the years during the summer. I have been there at the dam when all of the gates were lowered and the water level on the upper St. Lawrence was high. I have been there when the two gates were open for small craft and the upper river was high and also low. Controlling the level of Lake St. Lawrence affects the level of the upper St. Lawrence. I'm not digging through the old polaroid pictures to prove it.
Sent from my SM-G965U using Tapatalk
-
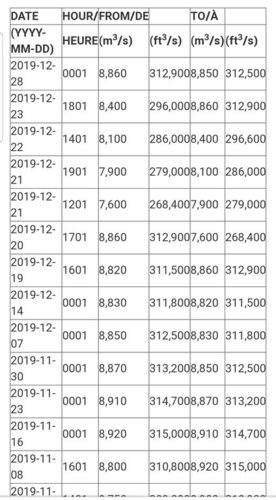
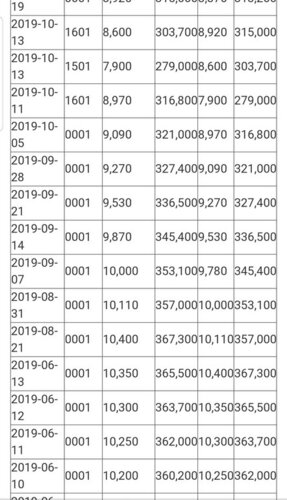
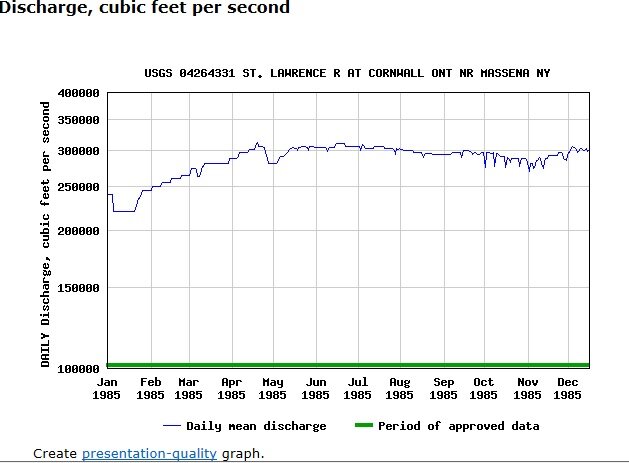
Take the time to look at all the graphs you just posted. Almost always flowing under 300,000. We were at almost 370,000 all summer long and even now are above 300,000. The current winter flow reduced output is still higher than the high flows just about every graph shown. Flows are up, not down and have been for 3 years outside of the 2017 and 2019 spring flooding on the Ottawa that couldnt be prevented. Remember increasing flows enough to drop ontario an inch in a week during those events would have raised the water level a foot in Montreal. It was the lesser of 2 evils and undoubtedly cost us this spring but nothing could be done.
Sent from my SM-G965U using Tapatalk -
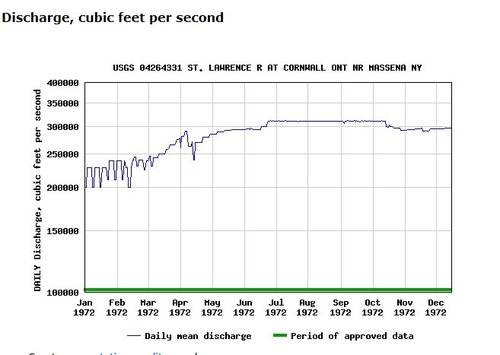
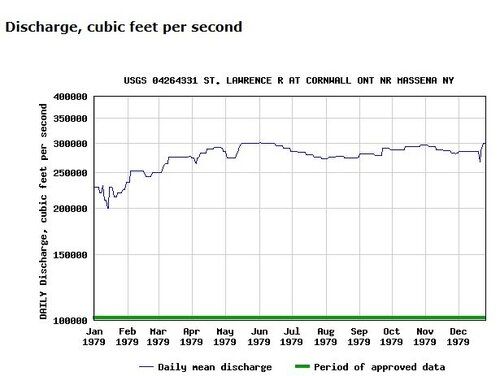
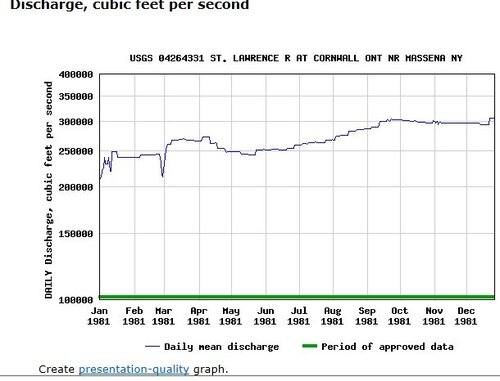
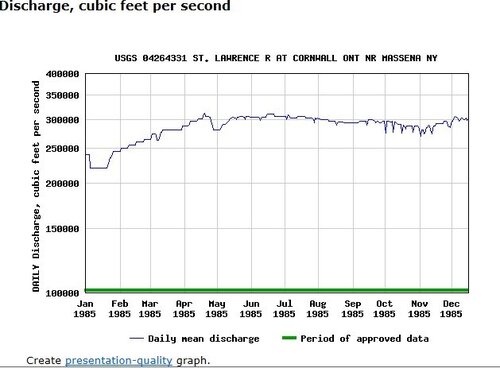
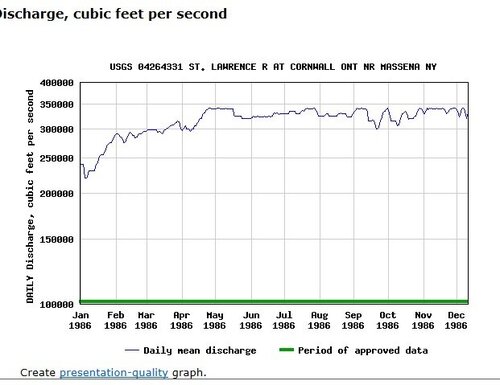
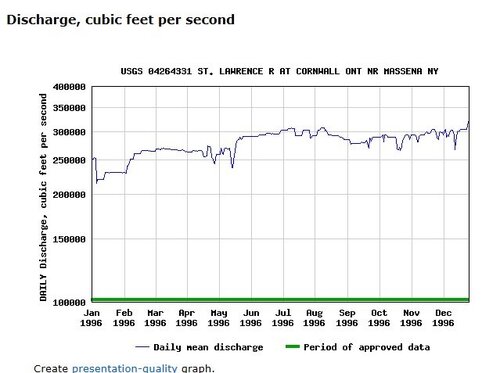
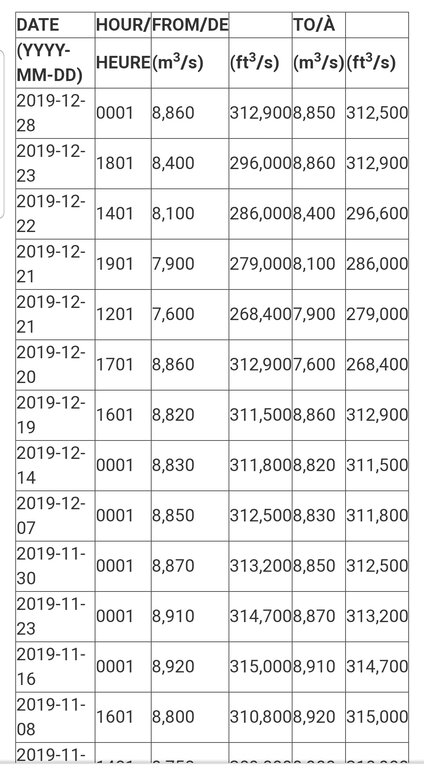
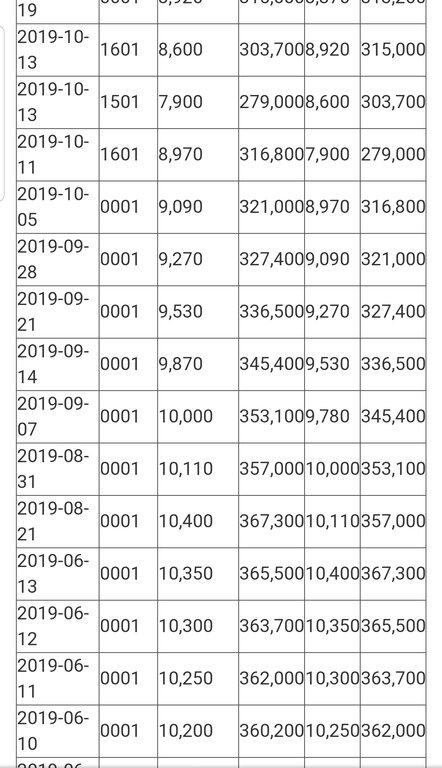
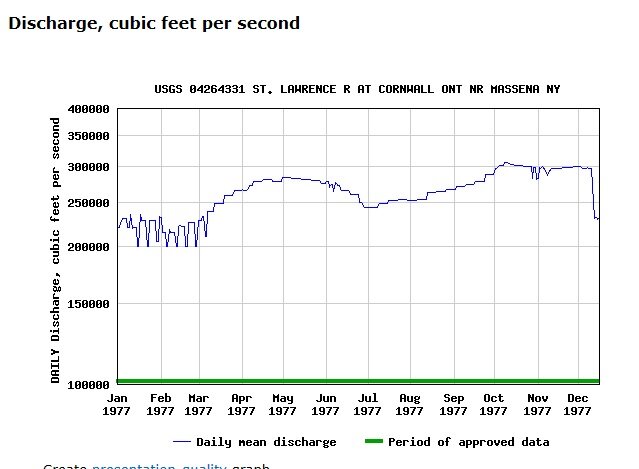
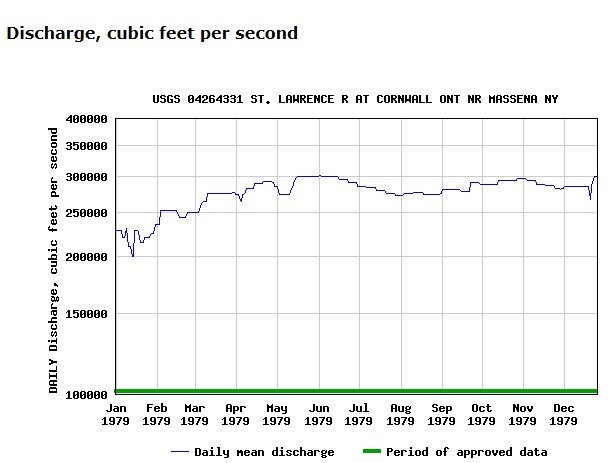
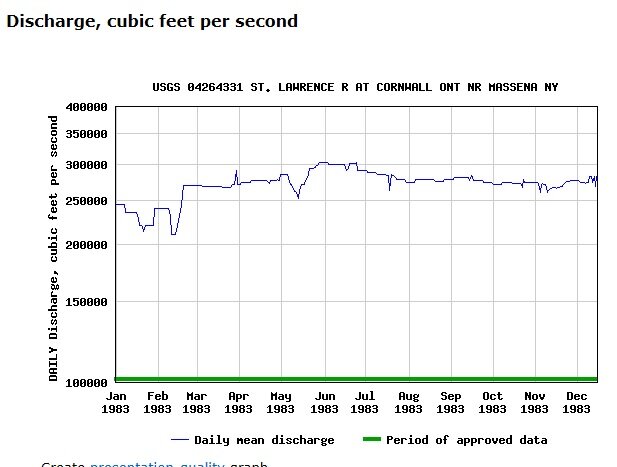
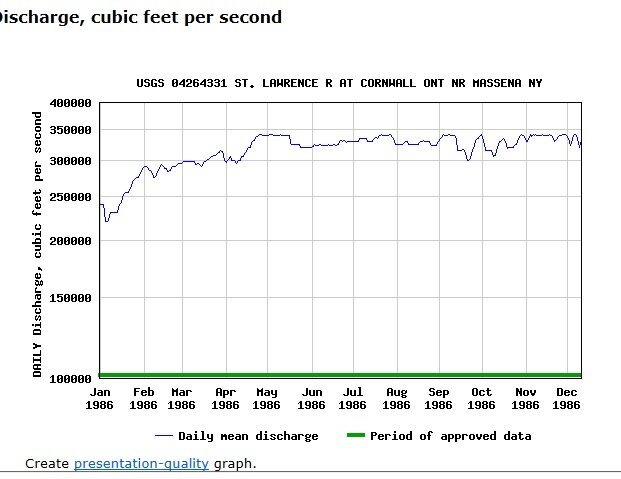
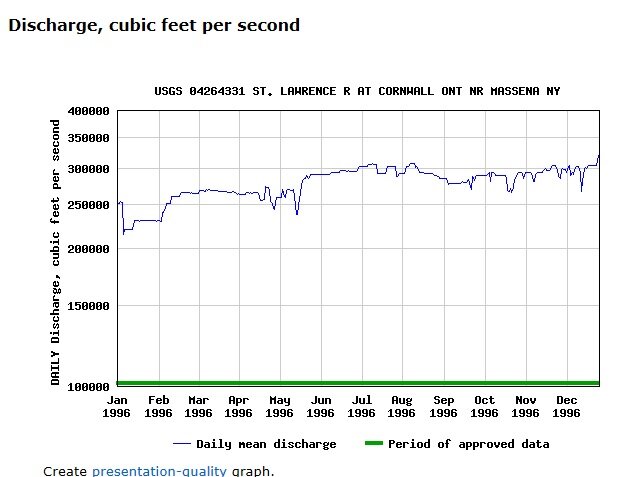
That april and may drop was because of the conditions on the Ottawa. As soon as the Ottawa was under control they put the flows back up right along with the receding water and kept it as high as possible. That was an emergency flow reduction and had nothing to do with 2014. Why are we even debating that at this point. As for reducing flows in december? Again we reduced from record flows to still above normal flows. Compare the actual numbers. We are still letting out more water right now than any of those years.The years 2000 thru 2014 were a period where the upper lakes were consistently at fairly low historical levels. (Check out iiwh's graph previously posted) For these years, I agree that seaway control did lower the outflows in December as he stated. i.e to the 6-7K range. However if you go back to where they were not at consistently low levels, they did not lower the outflows of Lake Ontario. Specifically years, '67, 72, 77, 79, 81, 83, 85, 86 & 96 they did not significantly lower the outflows in December.
(according to what the seaway control reported to Army Corps)
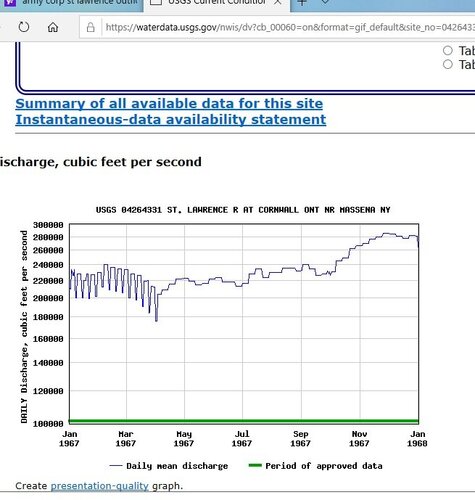

:(They dropped this one in Jan '78)
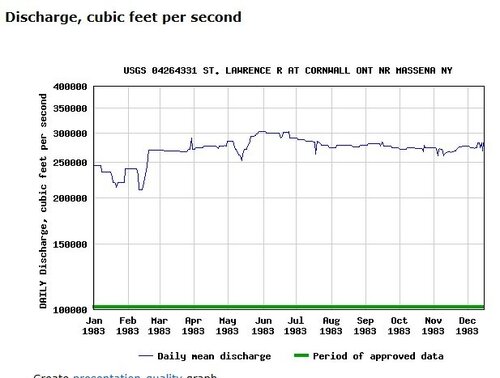
For reference 300,000 cuft/s = 8,500cuM/s
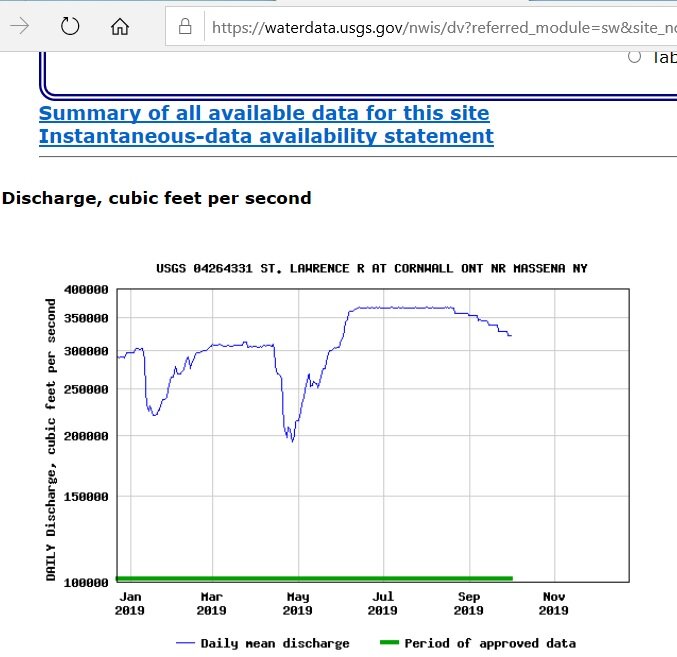
Plan 2014 was developed based on the years 2000-2014. If they had looked at any of the outflow data prior to that, they would have seen that historically the increase in outflow should begin in March (as shown above) and not a drastic dip in April-June nor begin a decrease in Sept as shown below on the 2019 outflow graph.
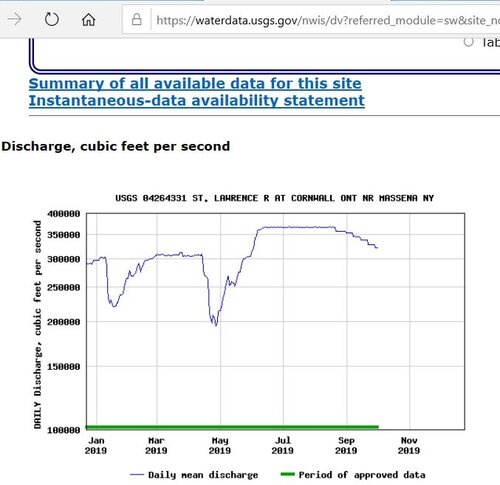
That 2 month drop (Apr-Jun) never should of happened.
Saying that outflow can't be increased because there is not enough water supply is bogus. Water level wasn't as high back in '86, yet they kept the flow pretty close to 340K from May thru December that year.
As to the 20yr cycle - That's probably pretty close on the upper lakes. But it hasn't been true for Ontario. (again look at iiWh's previously posted graph for Lake O)
Sent from my SM-G965U using Tapatalk
-
They dont measure flow through the iroquois dam that I know of. They measure water levels on lake st. Lawrence and try to keep them stable. Gates are either open or closed and the water that passes through it is measured by how high Lake st Lawrence gets. For years they pretty much never closed those gates that I know of, in fact the dam itself is considered "closed" because it isn't needed for any sort of constant regulation.. In 2017 they were closed for the entire summer to slow flow because with them open Lake st. Lawrence was raising too high especially around waddington where the river narrows around the island and tends to flood. I know the gates were open in September this year when I was there but my guess is they were closed from april until atleast August with the water levels that we had. With current water levels the gates wouldnt be needed unless they were expecting an ice jam somewhere.
-
I'm saying it's not the reason the water level drops on lake at. Lawrence and even when every single gate is wide open as they usually are on a typical year it still happens. Even with those flood control gates in the elevated position they can let water out at massena faster than it can make it through the bottleneck. The flood gates were closed at iroquois most of the summer and massena still flowed at 10,400. Gates are open again now and flows are actually lower. Those gates are another tool to prevent flooding but they are not currently what effecting water levels. They are just a damage control in a way, usually you can drive the boat right under the gates the whole season. It's not a big elevation drop dam like the ones in Massena. You can look on youtube and check out how the iroquois flood gates work if you need a better understanding.
-
9 minutes ago, lost a lure said:
Do you have any "data" to back that statement up about the Iroquois Dam not controlling the flow? Now that the winds are from the Northeast flow should be able to be increased.
The iroquois dam certainly does "control flow". That's what it's there for, but it's the bottleneck effect of the river that causes lake st. Lawrence to drop when it does even while the flood gates at iroquois are wide open. That's why Iroquois was built in the first place was a flood control measure after they excavated that portion of the river to eliminate a major portion of the bottleneck. Lake St. Lawrence drops drastically quite often even with everything above it flowing freely. A simple wind change can slow the river enough to drop Lake. St. Lawrence multiple feet in a day if flows at Massena arent adjusted accordingly.
Northeast winds slow the current and push water away from the river, how would you see that as a trigger to increase flow?
-
4 minutes ago, lost a lure said:
"Because water is no longer high enough to keep up a flow rate of 10,400. As a river drops flow decreases. If they did open up the long saulte and allow water to flow over it like they did this summer when the water was 2 feet higher the water in Lake St. Lawrence would drop drastically because the st Lawrence between lake ontario and ogdensburg isnt providing the same amount of water it was during summer peak levels."
What about increasing the flow through the Iroquois Dam?
It doesnt slow flow, the neck down in the river does in that portion of the river. So the seaway is separated by a series of "lakes". Basically reservoirs created by the dredging and daming of the river. When lake ontario was all the way up this spring and summer we couldnt let the water out fast enough to drop the "reservoir" above the massena dams. Once it started to drop Lake ontario and the river didnt feed the uppermost lake fast enough to maintain 10,400, which was an all time record for a sustained flow. When lake st. Lawrence began to drop faster than it was being fed they reduced natural flow from lake ontario the flows at the massena dams had to be reduced to keep it all in balance. On the same note when lake st. Francis or lake st. Louis begin to rise they back off how much they let through from up above. It's all effected by winds, rain, water level, every environmental factor you can think of. That's why you can watch the flows constantly being adjusted. Just watch what happens after sustained heavy west winds, flows will increase to account for the increased water pushed eastward by the rising waters caused by the siech on lake ontario.
-
It still has to make it's way down the river. Lake Eries flow into lake Ontario through the Niagara right now is what 7000? We continue to push it out faster than it's coming in, hell faster than it's ever been done in history and it's still not enough to convince you this isnt being done purposefully. Ur right, let's just kick it up to 10, 400 and watch lake st. Lawrence drop 4 feet in a day and then the next day flow will be 5,100. That makes sence.No it doesn’t. It comes down to letting as much out as you can, as early as possible in order to be able to accept the rain and melt you are talking about.
I’m done with this thread.
Hope you’re right.
Sent from my iPhone using Lake Ontario United
Sent from my SM-G965U using Tapatalk
-
We as a reference to those living on Lake Ontario. I can see the lake from my mailbox at the end of my driveway.
You keep using the term “we” in referencing water outflows. For the benefit of full disclosure, are you part of the IJC board?
Sent from my SM-G965U using Tapatalk
-
17 minutes ago, HB2 said:
So the simple question now has been answered .
We are not at max outflow now , 8600 from 10,400.
Now, " WE" would like to know why that is .
Especially since "WE" all know the amount of water coming at us from upstream . I
Because water is no longer high enough to keep up a flow rate of 10,400. As a river drops flow decreases. If they did open up the long saulte and allow water to flow over it like they did this summer when the water was 2 feet higher the water in Lake St. Lawrence would drop drastically because the st Lawrence between lake ontario and ogdensburg isnt providing the same amount of water it was during summer peak levels. Once again that number is calculated based on water passing through the moses sauders dam, water spilling over the long sault spillway, and the massena and Raisin river bypasses.
It's a non stop delicate balance with those reservoirs there. Hell an east wind forces them to reduce flows or lake st. Lawrence will drop and lake st. Louis will rise, a west wind had the opposite effect. The goal is to keep the river stable while draining the lake as fast as possible. 10, 400 isnt possible with the current lake level. We dont have enough "pressure" anymore to sustain that flow. It really is flowing out as fast as possible right now and they have no reason to do otherwise. Zero benefit to holding back water right now.
-
Just now, whaler1 said:
Going to be pretty ugly this spring and summer. No doubt about that.
With 35 plus years of watching levels with my eyes, not all these stupid charts, it’s going to be awful.
Sent from my iPhone using Lake Ontario UnitedEverybody said the same in 2018. Wet spring never came and we were fine. It all comes down to snow melt and precipitation.
-
Just now, GAMBLER said:
It doesn't work that way because the plan is flawed. There is no excuse to not let excess water out when possible when we have the Niagara dumping more water in than normal and Lake Ontario way above average. This is peoples frustration with the IJC and plan 2014. They are not doing ALL they can to minimize flooding.
But none of that has to do with 2014. None of this has been altered by 2014s parameters because the water has been too high to allow them to take effect since its come into play. 2014 allows for lower winter water levels on lake Ontario. It actually has parameters that allow us to let more water out than they ever did previously. Currently we are letting out more than any of us have ever seen in the month of December. With all this happening we still are somehow placing blame on 2014. It's just not the case. All i keep reading is "they arent doing all they can do". Please find me a time in history when they have done more, let out more or kept flows high longer.
You all act like I have a horse in the race or money to be made from 2014. I could care less in the end but the facts lead to the same conclusion no matter how u look at it. All the great lakes are at record or near record levels, so are we and that's no coincidence caused by a water management plan.
-
Sorry I misspoke. 10 inches over 2018 december. Correct we are 18 over long term avg. We will be 20 after next month I bet. Point is we went from the same level over avg as erie to 12" lower. We are dropping much faster than Erie currently thanks to increased flows.


Is there hope ?
in Open Lake Discussion
Posted · Edited by iiwhistlerii
This is good to see. Hope for warm temps and west winds so they push out as much as possible before backing down for ice formation again.