

LongLine
-
Posts
4,171 -
Joined
-
Last visited
Content Type
Profiles
Forums
Events
Gallery
Store
Everything posted by LongLine
-
 The "wait and see" approach is a re-active standpoint. The good old days aren't coming back. Unfortunately reacting to events on Big-O have taken a long time in recent history. Add 3-4 years after implementation to see substantial results for the Salmon. (Their time to mature.) We've seen phosphorous & chemical decline. We've seen stocking cuts. We've seen decreases in daily limits. We've seen this size decline for near 20 years. I believe in pro-active approaches. Rather than sit at computer complaining, here's a suggestion: Close the Salmon River, 7-10 days (one time event) for Salmon during egg-take time. Hire students from ESF, Cornell, Buffalo, Potsdam etc. Take the eggs & milt from large salmon and put in one "bucket." Take eggs & milt from smaller salmon & put in another "bucket." Raise/treat them the same; differentially tag them (with the clipping/marking trailer); Pen Rear them side by side, (perhaps at the SR.) Monitor them at fishing tournaments. Ask charter boats to be on lookout and "mail" them/data in. Then finally collect and analyze marked samples at the appropriate egg take time and report the results. I'm hoping someone from DEC is monitoring this thread and will chime in.
 -
A lot of people and agencies have put a lot of hard work into it and built Lake Ontario into a world class fishery. The majority of out-of-staters come here for a chance to catch a trophy size Salmon. It has become an economic boom to many local economies as well as to the state. Some may be very happy with 10 or 15 Lbr's but with a daily limit of 3 and a 25 Lb minimum to enter the LOC, IMO, the tourist numbers (and $) will decrease given that the size of the "trophies" has a downward trend. Additionally, according to reports on this board, the majority of us, when we catch "little ones," move deeper to search out the "bigger ones." I believe it behooves us, the fishery and the economy to find out why there is a downward trend and possibly reverse it, or at least stabilize it.
-
I'll believe that. But when did pen rearing start? Pre 2004? (Actually 2001 given they had to grow for 3 yrs) i.e. what did they catch up to? The graph above shows two distinct weight ranges for 3 yr olds that breaks thereabouts 2004. Basically 18-22 for pre 2004 and 15-18 for 2005 to 2021. When I graph the summer weight gain mean data differences (DEC numbers above) it looks like this: The average gain from '91 to '04 is 1.1 whereas after 2004 is 1.9. Throwing out the years 2010 & 2011, (due to low sample size) the average is 1.3. So if the average weight gain went up, or basically stayed the same, the question is so why didn't the yearly mean weights go up to previous weight ranges shown on 2nd previous graph? (i.e. 18-22) If the average weight gain went up, or stayed the same, we can't blame alewife quantity. We also can't blame alewife nutritional value due to invasives, cleaner or warmer lake. It has to be genetic. I can't fathom (no pun intended) anyone genetically engineering a smaller fish.
-
Well, I guess size matters...(or so she said...heh, heh, heh) The DEC has collected data on Chinook size for a long time and has published it in the Lake Ontario Unit Annual reports. Here's their graph from 2021 report. Interesting is the spike in 2011-2013. However looking at their data they didn't have a very large sample size in those years which makes those data points suspicious. (My stat's teacher taught that any less sample than 30 couldn't accurately represent a population.) While I agree there have been ups & downs in the quantity and quality of the Alewife populations, there seems to me that something else is going on here and it's been going on for even longer. My guess is that it is genetics, but not that some lab is playing around. Stocked fish are fed and treated for diseases not size. When did the "big dip" in size (according to DEC data) occur? Back in 2002-2004. When did natural reproduction of salmon come into the lime-light? Actually it was first noticed in '98-'99 but not taken seriously except by some scientists at ESF who showed that it could be happening on a larger scale than anyone thought. Anecdotaly, it was reported that Natural Repo fish were feistier and at one of the annual meetings, it was reported that they were leaner and a little smaller than the clipped fish. (It was theorized that Nat Repro fish weren't as well fed during the 1st few weeks of life. ) When the DEC finally undertook the study, they concluded that a substantial amount of Nat Repro was occurring. Given that the fish reach sexual maturity in 3-4 years, is it possible that some genetic mixing unknowingly occurred at egg-take time? Do the graphs show that? How do you tell the difference between stocked and Nat Rpro fish? Even though there still is some variablity shown on the graphs, the trend is definitely downward. Another question arrises. Namely Pen rearing. While we all agree that it's great for survivalbilty, does having a different diet than the Naturals for those few weeks, have any bearing?
-
Just got the note: DEC collected 2.4 million eggs from 510 female Kings and 787,000 eggs from 247 Cohos at SR this year.
-
Get ahold of Hank (L&M, moderator on this board) Port Bay. Highly recommended for anything boat related.
-
Please refresh my memory...Has the DEC ever had a shortfall in obtaining eggs due to insufficient numbers of returning fish? (DEC has already changed the stocking strategy in last few years to protect the broodstock there.) If so: (1) Other game fish such as Bass, Pike & Lakers have closed seasons so they can spawn. That river season could be closed for 7-10 days. Other places around the lake would probably love a weeks' worth of additional business during those 7-10 days. or (2) Fire up the Seth Greene & landing barge to net them off the mouth. If not, then it's moot. As to violators during this time of year: (1) Why can't DEC contract local/off duty officers or law enforcement depts to catch snaggers & the over limit catches for a couple week period? Law officer contractors wouldn't have to know all the conservation laws, just the basics like all of us. A one-day class would probably be sufficient training for it. They already know the police/people part of the job. Most of them are fishermen and/or hunters anyways. and (2) Give the fines to the community that catches them, just like speeding tickets & registrations go to the locality? Maybe put a surcharge on them like vehicle violations. After all it is in the local community's best interest to protect the fishery, especially Pulaski. (Vehicular "speed traps" love this part as it's a good revenue raiser)
-
I pull mine out of boat when putting it up for winter and store it inside house next to side door, in the battery case which I know is dry. I found out years ago that if you store it in damp basement on concrete (even if on wood) it'll discharge itself pretty quick.
-
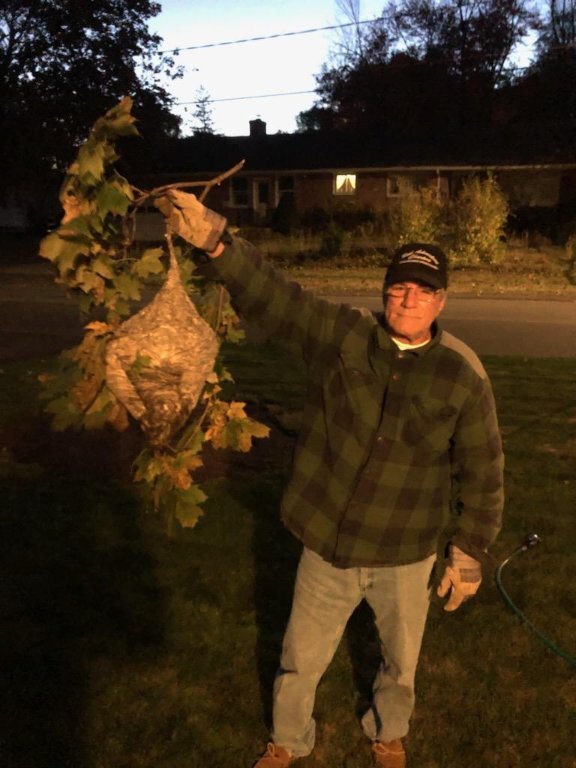 Had a big nest up in the peakof my house. 1st thought was just get the big ladder out, spray it, knock it down. 2nd thought was what if the buggers come after me & I fall off ladder. (20 ft in air) I called an exterminator. 1/2 of an hour after he sprayed it, he swept up over 200 dead ones in the driveway with a couple still buzzing around the peak. They haven't been back.
 -
Genesee 10/7
LongLine replied to lumberjohn's topic in New York Fishing Reports - Lake Ontario (South Shore)
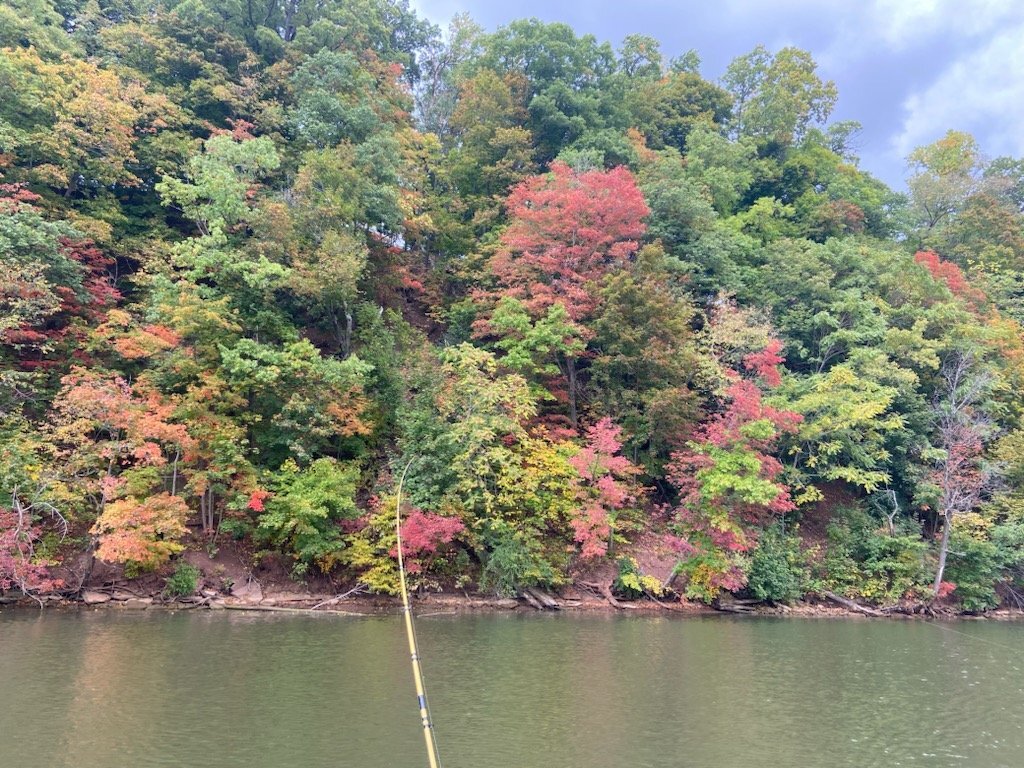 Gorge is pretty this time of year & worth the slow cruise.
 -
They track great. I've used one on my 2nd rigger for years.
-
Turtle Fish
LongLine replied to Pete Collin's topic in New York Fishing Reports - Lake Ontario (South Shore)
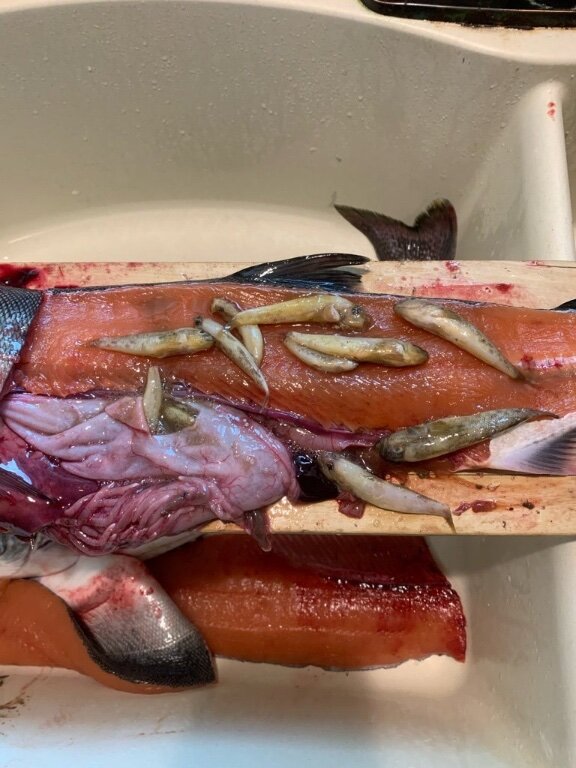
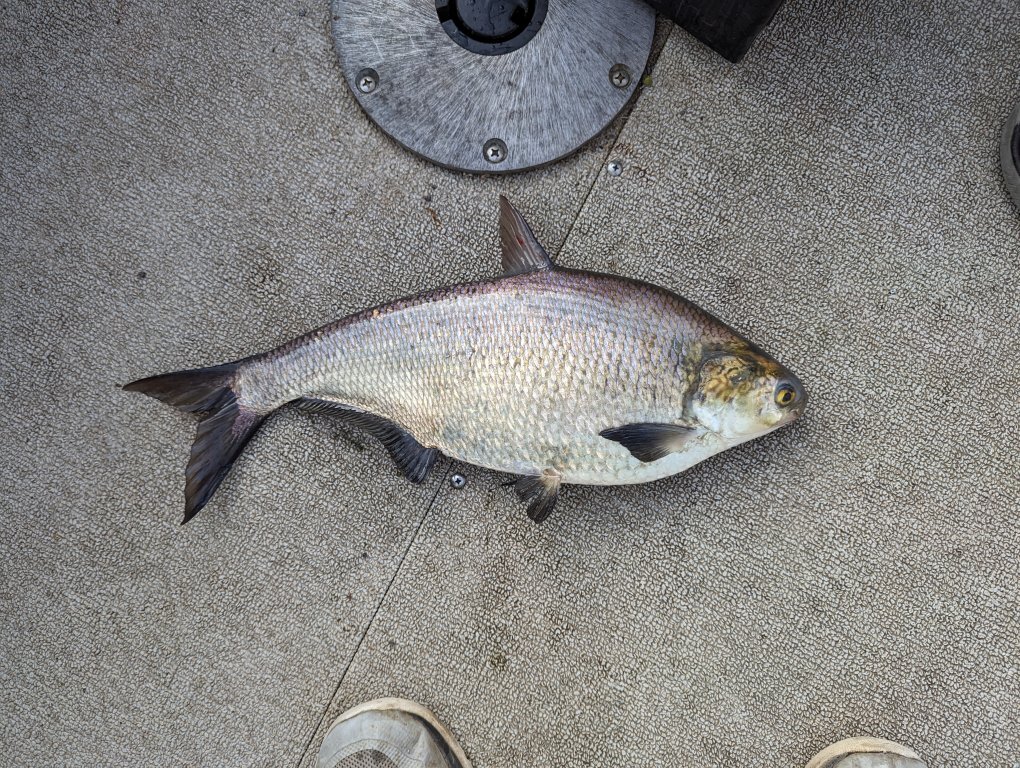 Definitely a Shad. Years ago, I caught a Northern Pike at Port Bay that had over 20 of them in him.
 -
So how many laws does NYS have? Which are regulations? Ordinances? Not even going to guess at the Federal laws or treaties. (Not to mention daily changes) Even though some people seem to think they know everything, I find that highly doubtful.
-
Historically, native-Americans /indigenous people have been more conservation minded than any other "group" of people.
-
Many modern electronics have programable memories that are not hard written and require a few milliamps to maintain the program. I'd turn everything off in the boat and test the circuit with a voltmeter/ampmeter.
-
Switches to turn things on/off, as well as fuses should always be on the hot side of the unit being turned on/off. i.e. red. (If I read your question correctly)
-
 Sherman - exactly!
 -
Siwash hooks!
LongLine replied to Long time fisherman's topic in Questions About Trout & Salmon Trolling?
I've been changing trebles to singles for close to 50 yrs. I use 3/0 Gammys on 28 size spoons. Point the hook towards the cup side of the spoon. I've found the get a much more solid hookup; are easier to sharpen; don't get caught in net; are easier to remove from carpet flooring as well as easier to remove from fingers. (heh, heh, heh) -
Thanx Brian!
-
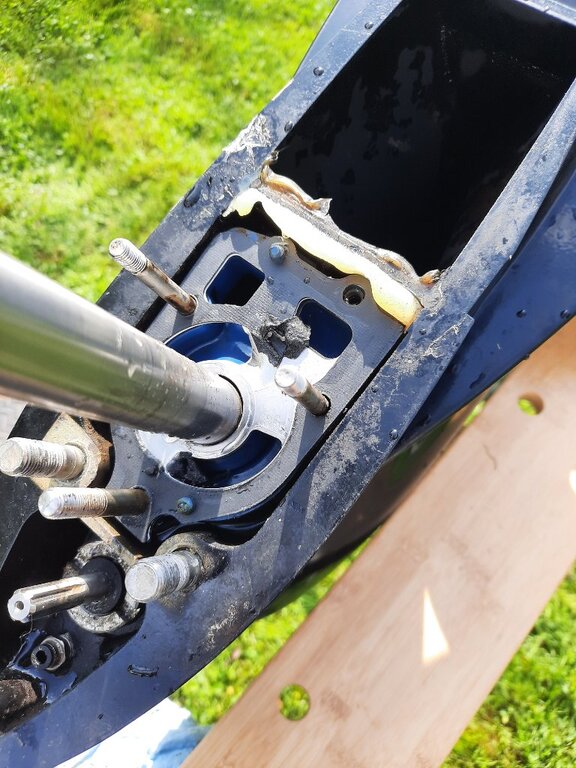
There's a plate between the exhaust manifold and the water jacket. Exhaust on one side, water on the other. If that plate wears thin or develops pin holes due to ethanol gas or additives that cause acidic exhaust, then the outflow of water will get hot. You'll inadvertantly burn some water while running and eventually cook your motor. (Been there, done that) Modern engines use a coated/treated plate that resists acidic exhaust.
-
S.B. - Funny thing is that just the week before, it ran perfectly. I learned from my Dad, back in the late 50's to always check the outflow when ever I start a motor, which I've done religiously ever since. I've never had this happen before. Impeller was in great shape.
-
My 75 stopped peeing a month ago or so. Not having the umph to pull the lower unit, took to Hank down at Port Bay. He changed impeller for me but found the outlet tube plugged up. He said it smelled "like pine" and fished it out with wire. Never heard of it before but possible bug slime.
-
IBay 9/3 ,4
LongLine replied to Pike Hunter's topic in New York Fishing Reports - Lake Ontario (South Shore)
.jpeg.d1c9f96161bf8a33868c8b6da15cfb32.jpeg) P.H.
P.H. -
Officials begin lowering Lake Ontario, St. Lawrence River
LongLine replied to salmoseine's topic in Open Lake Discussion
Too bad Roch 1st didn't read the press release. They're going to keep the water level UP. -
Rochester
LongLine replied to Missdemeanor's topic in New York Fishing Reports - Lake Ontario (South Shore)
 WTG Miss D.